

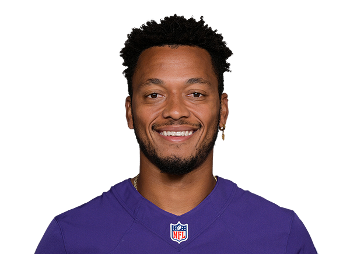
IN YOUR LEAGUE
Brett Hundley in your league
Who drafted Brett Hundley in your league, and did it win them a title?
Connect your league to see every season he spent in it: what he cost, who started him, and the titles he won.
Connect your leagueYahoo · Sleeper · ESPN · CBS · MFL · Fleaflicker · Fantrax
THE STATS
Brett Hundley stats by season
Brett Hundley's NFL stats and fantasy points every regular season, with his finish among QBs by total points. Pick a scoring format to switch the points.
| Passing | Rushing | Other | |||||||||||||
|---|---|---|---|---|---|---|---|---|---|---|---|---|---|---|---|
| Season | GP | Points | Per game | Finish | Cmp | Att | Yds | TD | Int | Att | Yds | Y/A | TD | Fum lost | Snap % |
| 2017 | 11 | 132.4131.9131.4 | 12.012.011.9 | QB30QB30QB31 | 192 | 316 | 1,836 | 9 | 12 | 36 | 270 | 7.5 | 2 | 2 | – |
| 2016 | 4 | -1.5-1.5-1.5 | -0.4-0.4-0.4 | QB71QB71QB71 | 2 | 10 | 17 | 0 | 1 | 3 | -2 | -0.7 | 0 | 0 | – |
| Career | 15 | 130.9130.4129.9 | 8.78.78.7 | 194 | 326 | 1,853 | 9 | 13 | 39 | 268 | 6.9 | 2 | 2 | – | |
Regular season only. Finish is his rank among QBs by total points that season. Stats from the NFL's official box scores.
THE GAME LOG
Brett Hundley game log
Every week: his stat line and fantasy points, his finish among QBs that week, and what real leagues did with him: the share that rostered him, how often managers started him, and how often their team won when they did.
Points by week
Hover or tap a bar for his line. Follows the scoring toggle.
2017 game log
| Passing | Rushing | Other | In real leagues | |||||||||||||
|---|---|---|---|---|---|---|---|---|---|---|---|---|---|---|---|---|
| Week | Points | Finish | Cmp | Att | Yds | TD | Int | Att | Yds | Y/A | TD | Fum lost | Snap % | Rostered | Started | Team won |
| 4 | ––– | ––– | 1 | 1 | 0 | 0 | 0 | 0 | 0 | – | 0 | 0 | – | – | – | – |
| 6 | 6.66.66.6 | ––– | 18 | 33 | 157 | 1 | 3 | 1 | 3 | 3.0 | 0 | 0 | – | 2% | 0% | – |
| 7 | 11.911.911.9 | ––– | 12 | 25 | 87 | 0 | 1 | 3 | 44 | 14.7 | 1 | 0 | – | 28% | 56% | 42% |
| 8 | Did not play | 13% | 0% | – | ||||||||||||
| 9 | 18.018.018.0 | ––– | 26 | 38 | 245 | 0 | 0 | 4 | 22 | 5.5 | 1 | 0 | – | 17% | 54% | 45% |
| 10 | 14.114.114.1 | ––– | 18 | 25 | 212 | 1 | 0 | 2 | 16 | 8.0 | 0 | 0 | – | 11% | 41% | 40% |
| 11 | 5.55.55.5 | ––– | 21 | 36 | 239 | 0 | 3 | 3 | 19 | 6.3 | 0 | 1 | – | 12% | 42% | 36% |
| 12 | 22.422.422.4 | ––– | 17 | 26 | 245 | 3 | 0 | 1 | 6 | 6.0 | 0 | 0 | – | 9% | 14% | 41% |
| 13 | 9.09.09.0 | ––– | 13 | 22 | 84 | 0 | 1 | 7 | 66 | 9.4 | 0 | 0 | – | 17% | 53% | 38% |
| 14 | 25.725.725.7 | ––– | 35 | 46 | 265 | 3 | 0 | 7 | 31 | 4.4 | 0 | 0 | – | 9% | 41% | 66% |
| 15 | Did not play | 8% | 15% | 29% | ||||||||||||
| 16 | 8.08.08.0 | ––– | 17 | 40 | 130 | 0 | 2 | 5 | 48 | 9.6 | 0 | 0 | – | 6% | 22% | 23% |
| 17 | 11.410.910.4 | ––– | 14 | 24 | 172 | 1 | 2 | 3 | 15 | 5.0 | 0 | 1 | – | – | – | – |
| Total | 132.4131.9131.4 | 192 | 316 | 1,836 | 9 | 12 | 36 | 270 | 7.5 | 2 | 2 | – | ||||
2016 game log
| Passing | Rushing | Other | In real leagues | |||||||||||||
|---|---|---|---|---|---|---|---|---|---|---|---|---|---|---|---|---|
| Week | Points | Finish | Cmp | Att | Yds | TD | Int | Att | Yds | Y/A | TD | Fum lost | Snap % | Rostered | Started | Team won |
| 1 | Did not play | 1% | 0% | – | ||||||||||||
| 2 | Did not play | 1% | 0% | – | ||||||||||||
| 3 | Did not play | 1% | 0% | – | ||||||||||||
| 4 | Did not play | 1% | 0% | – | ||||||||||||
| 5 | Did not play | 1% | 0% | – | ||||||||||||
| 6 | Did not play | 1% | 0% | – | ||||||||||||
| 7 | Did not play | 1% | 0% | – | ||||||||||||
| 8 | Did not play | 1% | 9% | – | ||||||||||||
| 9 | Did not play | 1% | 0% | – | ||||||||||||
| 10 | 0.30.30.3 | ––– | 1 | 4 | 8 | 0 | 0 | 0 | 0 | – | 0 | 0 | – | 1% | 0% | – |
| 11 | -1.6-1.6-1.6 | ––– | 1 | 3 | 9 | 0 | 1 | 1 | 0 | 0.0 | 0 | 0 | – | 1% | 5% | – |
| 12 | Did not play | 1% | 0% | – | ||||||||||||
| 13 | Did not play | 1% | 0% | – | ||||||||||||
| 14 | -0.2-0.2-0.2 | ––– | – | 2 | 0 | 0 | 0 | 2 | -2 | -1.0 | 0 | 0 | – | – | – | – |
| 16 | ––– | ––– | – | 1 | 0 | 0 | 0 | 0 | 0 | – | 0 | 0 | – | – | – | – |
| Total | -1.5-1.5-1.5 | 2 | 10 | 17 | 0 | 1 | 3 | -2 | -0.7 | 0 | 0 | – | ||||
ROSTER %
How real leagues use Brett Hundley
Rostered and started, week by week
Share of real leagues.
| Season | Rostered | Started | Team won when he started |
|---|---|---|---|
| 2017 | 13% | 41% | 43% |
| 2016 | 1% | 1% | – |
Average week, weeks 1 to 14.
THE WIRE
Trades and waivers
The share of leagues where Brett Hundley was traded, picked up or dropped at some point in the season. He was traded in 1% of leagues in 2017.
| Season | Traded in | Busiest trade week | Added in | Dropped in |
|---|---|---|---|---|
| 2017 | 1% | Week 7 | 41% | 36% |
| 2016 | under 1% | Week 1 | 1% | under 1% |
Out of every league that season. A league counts once however many times he moved, and preseason moves count.
Common questions
What percentage of leagues roster Brett Hundley?
He was rostered in 13% of leagues in an average week of 2017 (weeks 1–14), and managers started him 41% of the time.
How often is Brett Hundley traded in fantasy?
He was traded in 1% of leagues in 2017.
Where do these numbers come from?
From real fantasy leagues connected to Fantasy Hall of Fame from Yahoo, Sleeper, ESPN, CBS, MFL, Fleaflicker and Fantrax: their drafts, weekly lineups, transactions and final standings. Every number covers at least 20 leagues; no league or manager is identified.